Your CFO will not sign off on a visibility platform because the demo looked good. The sticker price is rarely the true cost, and the number that decides the deal is supply chain visibility software TCO: everything the platform costs across the contract, set against everything it returns. Freight-visibility incumbents publish no price at all, which leaves you building that model one sales call at a time. This guide gives you the framework and applies it.
The framework has two halves. Total cost of ownership captures every cost you will carry over the term, visible and hidden. Return on investment captures what the platform gives back, measured against your own baseline rather than a vendor's showcase customer.
One question comes before either: whether a dedicated solution is necessary at all, or whether the tracking module inside your WMS or OMS already covers the job. For a high-volume DTC brand or retailer, that answer turns on the same cost and value math. If post-purchase suites are also on your shortlist, the same framework holds when comparing AfterShip against other enterprise solutions like Narvar.
Why TCO Is the Only Metric That Matters (And Why Most Vendors Never Publish One)
License fees are the tip of the iceberg. The subscription line is the number that appears in a proposal, and the rest arrives after signature, spread across IT, operations and customer service budgets that never saw the quote. True TCO includes license, implementation, training, and ongoing support costs.
A defensible model breaks the total into five cost-drivers. Frame each one as a question you put to every vendor on your shortlist, in writing, before the final round.
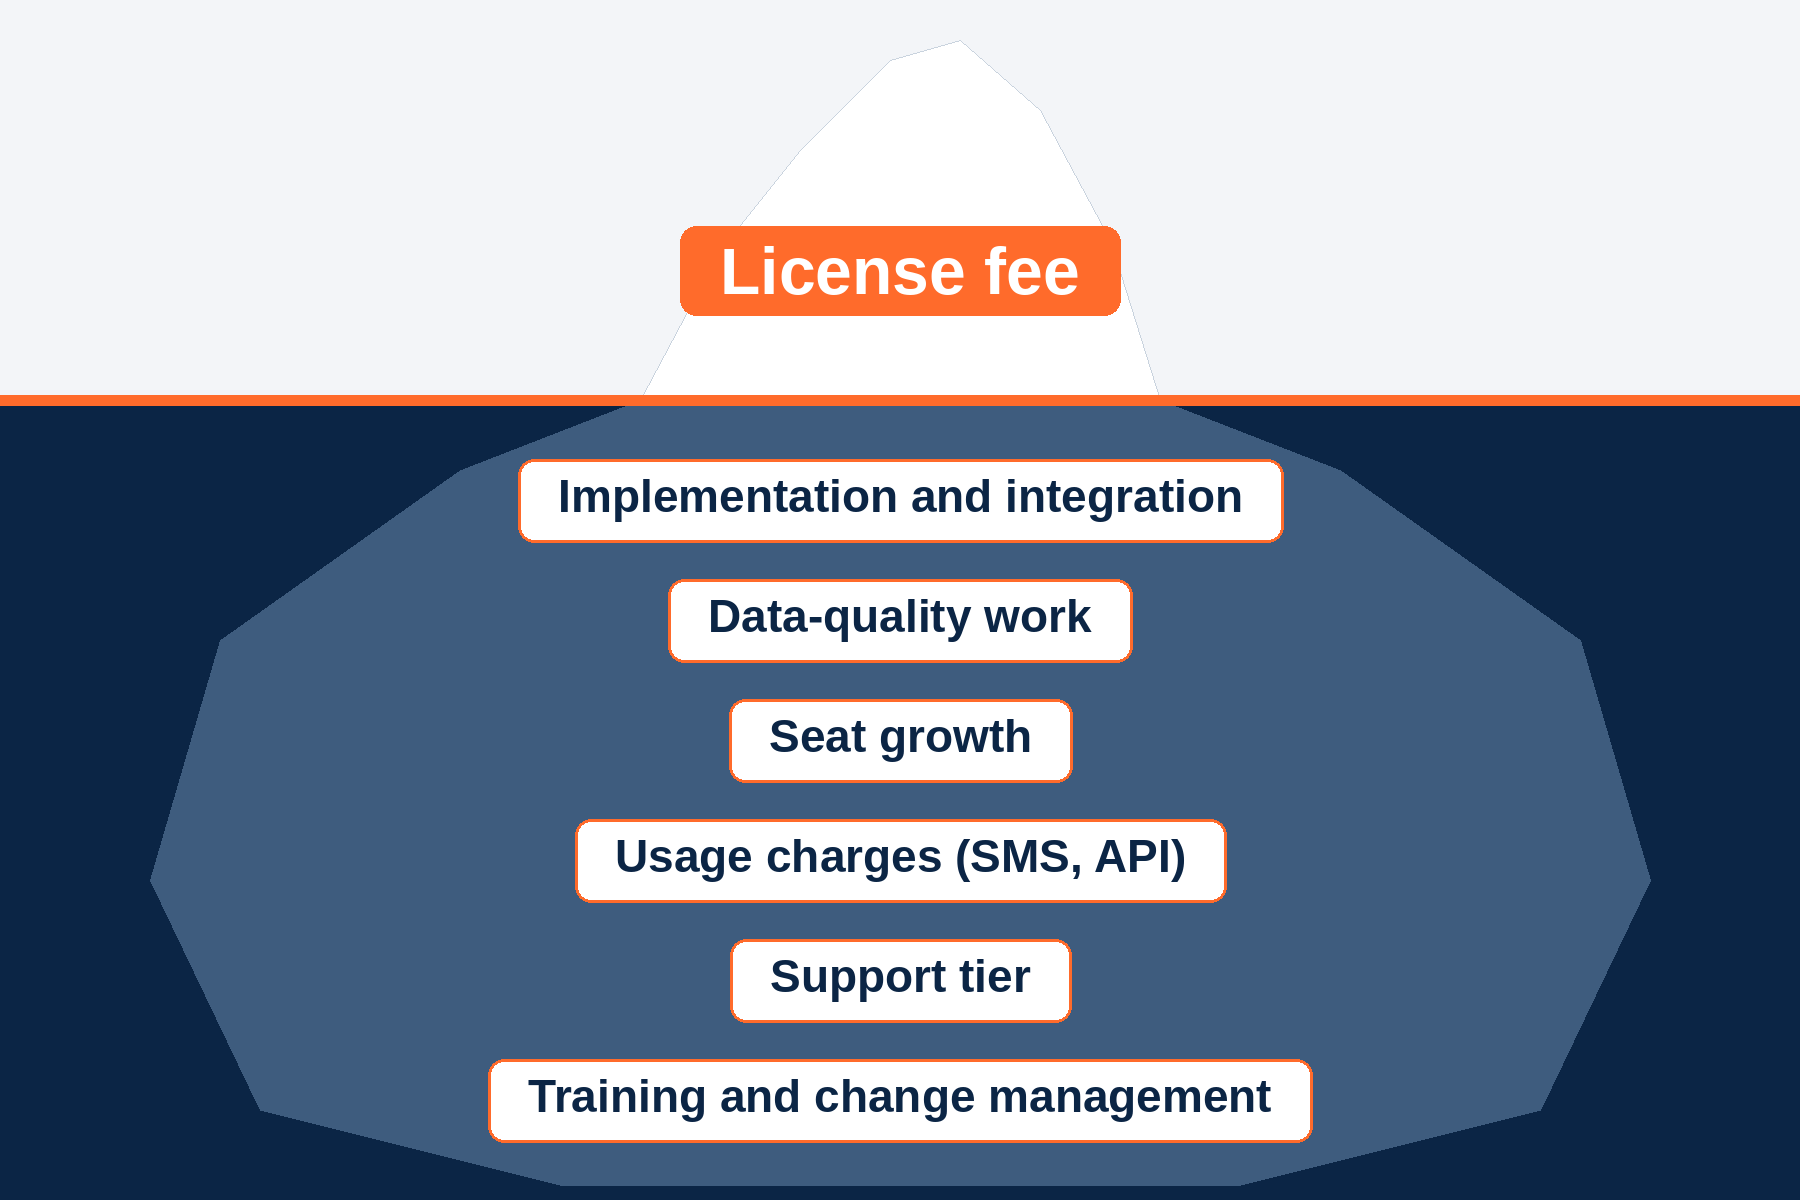
1. License and subscription. What is the price based on: shipments, orders, seats or a negotiated platform fee? What happens when your volume passes the plan quota, and is the answer a published overage rate or a renegotiation? A price you can calculate from your own shipment forecast is a price you can defend in a budget review.
2. Implementation and integration. How long does it take to go live, and does the vendor commit to that date? Connecting the platform to your OMS, WMS, storefront and helpdesk is paid for in internal engineering hours, and those hours stay off the vendor's proposal. Ask for the integration method, the systems supported out of the box, and the work your team owns. Ask too whether a parallel run is included and who staffs it.
3. Training and change management. Customer service agents, operations analysts and the marketers who edit your tracking page all need time to learn the tool. Budget their hours, plus the weeks when old and new processes run side by side. Include the time your CX team spends rewriting macros and help-center articles.
4. Ongoing maintenance and support. What do the support tiers cost, what response time does each tier commit to, and what does the contract commit to on uptime? A platform your customers see on every order needs a written service commitment with a remedy attached.
5. Hidden costs. Data-quality work comes first: cleaning carrier codes, mapping inconsistent statuses and fixing broken integrations. Seat growth follows as more teams log in, and usage charges such as SMS messages and API calls scale with volume. Ask for each as its own line item, because each one grows with the business.
These are the hidden costs of supply chain visibility software that surface in year two, when the renewal lands and nobody can trace the overrun.
Transparency is where this becomes a financial variable. A vendor that publishes its full cost structure lets you model TCO before the first meeting, while pricing held inside a sales process turns your model into a negotiation.
Model the full term rather than year one. A three-year view exposes the costs that scale: overage as volume grows, seats as more teams join, and support fees tied to the product fee. Put every answer into one spreadsheet, per vendor, per product and per year of the term. That sheet is the cost half of your business case.
The 4 Levers of Visibility ROI: From Cost Center to Profit Driver
Visibility software ROI is driven by reduced support tickets and increased LTV. In practice, supply chain visibility software ROI comes from four value levers. Treat each lever as a method: pull your own baseline, apply an assumption you can defend, and give your CFO the inputs to challenge.
This discipline is what separates a business case from a vendor promise. A figure built on your helpdesk export, your order history and your carrier invoices holds up under questioning, because every input has an owner inside your company.
- Reduce operational load. Proactive delivery notifications and a branded tracking page answer the "where is my order" question before a customer asks it, which cuts order-status contacts. Pull monthly order-status contact volume from your helpdesk, multiply it by your fully loaded cost per contact, and apply a reduction rate to get the annual saving. Separate contacts by channel, since a chat, an email and a phone call carry different costs, and your helpdesk tags will give you the baseline in an afternoon. The Aetrex customer story reports a 74% decrease in WISMO tickets and a 50% reduction in operation costs with AfterShip Tracking and AfterShip Returns, which shows how far a sustained reduction can reach.
- Protect and grow customer lifetime value. Delivery experience drives repeat purchase, and retailers are saying so publicly. Supply Chain Dive reported in June 2026 that executives at Macy's, Ulta Beauty and other companies say delivery reliability is more important than speed to maintain and grow their customer bases. Macy's Vinny Pagliuca put it plainly: "It's when you're not reliable is when we're going to lose our customers, and that's what we see." Aetrex's customer story records a lift of 141 NPS points. To size this lever, split last year's customers by delivery outcome, on time or late, and compare repeat purchase rate and 12-month revenue across the two groups. The gap, multiplied by your late-delivery volume, is the value at stake. Your order management system or your ecommerce platform's customer export holds the data, and the analysis fits in one pivot table.
- Lower carrier and logistics cost. On-time analytics by carrier and service level on your lanes shows where you pay for a speed you do not receive. Rank each carrier and service by on-time rate per lane, identify volume you can move to an equally priced or cheaper service that performs better, and value the move as the rate difference plus the late-delivery cost you avoid. Your carrier invoices supply the rates, while the on-time data has to come from tracking events normalized across every carrier you ship with, so the comparison is like for like. Include at least one full peak season, because a lane's performance in November can differ sharply from May.
- Mitigate risk and revenue loss. Accurate delivery promises reduce failed deliveries and the exceptions that follow them. Count last year's exceptions by type, including failed delivery, lost, damaged and delayed, then attach the cost of each: reshipments, refunds, the support contacts they trigger and the cancellations they cause. Apply a reduction rate per exception type rather than one blanket figure. Your customer service platform and your finance team's refund ledger hold most of these numbers, and failed deliveries deserve the closest look, since each one can cost a reshipment and a contact. AfterShip Tracking's AI EDD publishes delivery date accuracy of up to 95% and covers at least 80% of deliveries, which is the promise this lever rests on. As published on aftership.com/ai, Dr. Squatch saw 25% fewer WISMO tickets and 58% faster exception resolution.
Keep the four levers separate in your model. Each has its own baseline owner, its own assumption and its own sensitivity range, and a finance team will test them one at a time. A low, base and high case per lever holds up better in that review than a single headline number. Record who supplied each baseline and the date of the extract, so the model can be refreshed at renewal.
A Practical TCO Model: AfterShip vs Freight-First Visibility Platforms
Apply the five components to real vendors and the first difference is what you can model from public pages. AfterShip publishes transparent, shipment-based pricing, including overage, seat, and support costs.
On the Shopify App Store listing, AfterShip Tracking Essentials costs $11 a month billed monthly at 100 shipments a month, or $108 a year billed annually. Premium costs $70 a month billed monthly at 500 shipments a month, or $708 a year billed annually. On aftership.com, the Tracking pricing page shows the same two plans at $29 and $59 a month on annual billing at a slider volume of 6,000 shipments a year.
Shipments above the plan quota cost $0.08 or $0.12 each, depending on the plan. Team member seats cost $10 per member per month billed annually, or $12 per member billed monthly. SMS is charged by destination and billed on messages sent. Standard support is free, Silver costs 20% of the product fee with a $200 monthly minimum, and Gold costs 30% with a $400 monthly minimum. Enterprise, for brands above $10M in GMV, is custom, with a dedicated CSM and onboarding, Enterprise SLAs and SSO; seat, support and SLA terms are set in the Enterprise agreement.
Each product is billed separately and there is no hard spend cap; crossing a quota triggers alerts while service continues. Model TCO per product, never as one blended license. The contract commits to 99.9% Service Uptime with service credits. The Tracking API goes live in under 2 weeks, and the full suite of shipping, tracking, returns, and warranty takes 4 to 8 weeks with a parallel run.
project44 publishes no price, and FourKites states that it does not sell seats, with no published price. The one timing commitment project44 states is 95% data quality within 60 days of the start of a standard implementation, where customers and their carriers follow its best practices. That milestone measures data quality, and neither vendor publishes a go-live duration. Our head-to-head offers a detailed look at AfterShip versus project44's predecessor, Convey.
Both publish shopper-facing tracking, and project44 publishes pre-purchase delivery dates in the cart and at checkout. The difference is design center and depth: they are freight platforms extended into ecommerce, while AfterShip Tracking is built around the DTC post-purchase journey, from checkout promise to resolved exception. That depth is behind the WISMO reduction Aetrex reported.
| Criteria | AfterShip Tracking (Enterprise) | Freight-first visibility platforms (project44, FourKites) |
|---|---|---|
| Pricing you can model before signing | Published base, overage, seat, SMS and support pricing | No published price |
| Time to value | 4 to 8 weeks (full suite) with a parallel run; Tracking API live in under 2 weeks | No go-live duration published; 95% data quality in 60 days is a data-quality milestone |
| Design center and post-purchase depth | Built for DTC post-purchase, from checkout promise to resolved delivery exception | Freight-first platforms extended into ecommerce and last mile |
| Contractual commitments after signing | Published 99.9% Service Uptime with service credits and published support tiers | project44 publishes no contract term |
| Analytics that drive carrier decisions | On-time rate and EDD coverage by carrier and service on each lane | project44 publishes Last Mile Insights analytics |
| Customer-experience tooling | Branded tracking pages, proactive notifications and checkout delivery dates on one shipment record | Branded shopper tracking and alerts, extended from freight visibility |
Line-by-line feature detail sits in the specific capabilities of our project44 comparison. A project44 TCO comparison built this way shows the gap: the freight-first cells wait on a proposal, while every AfterShip cell fills from published pages today.
How AfterShip Tracking Analytics Turns Delivery Data into Dollars
The ROI levers only pay out if you can see where delivery breaks down. On-time Shipment Analytics, part of AfterShip Tracking, breaks on-time rate, EDD coverage and volume out by carrier and service across origin-destination lanes. Every lever in your model gets a measured baseline instead of an estimate.
Start with the question operations leaders ask most: "Which carriers and service levels are missing my on-time targets on my US domestic lanes?" Filter to your highest-volume origin-destination pairs, set your on-time target, and sort carrier services by the gap. A ground service that misses target on a lane where a comparable service hits it is a candidate for a volume shift. Because tracking events are normalized across carriers, a regional carrier and a national one sit in the same view, measured the same way. That answer feeds the carrier and logistics cost lever directly, and it feeds the operational load lever too, since late parcels generate order-status contacts.
The second question matters most before peak: "Is my peak-season delivery promise accurate?" On-time Shipment Analytics carries a Promised Delivery Date type, so you can measure delivered dates against the date you promised the customer, not only against the carrier's estimate. Seasonal spike detection flags when a lane's performance shifts with volume, which tells you when to widen a promise before customers feel the miss. Run it on last year's peak first, and the result becomes the risk assumption in your model. That analysis feeds the risk lever, because accurate promises reduce failed deliveries, and the lifetime value lever, because reliability brings customers back.
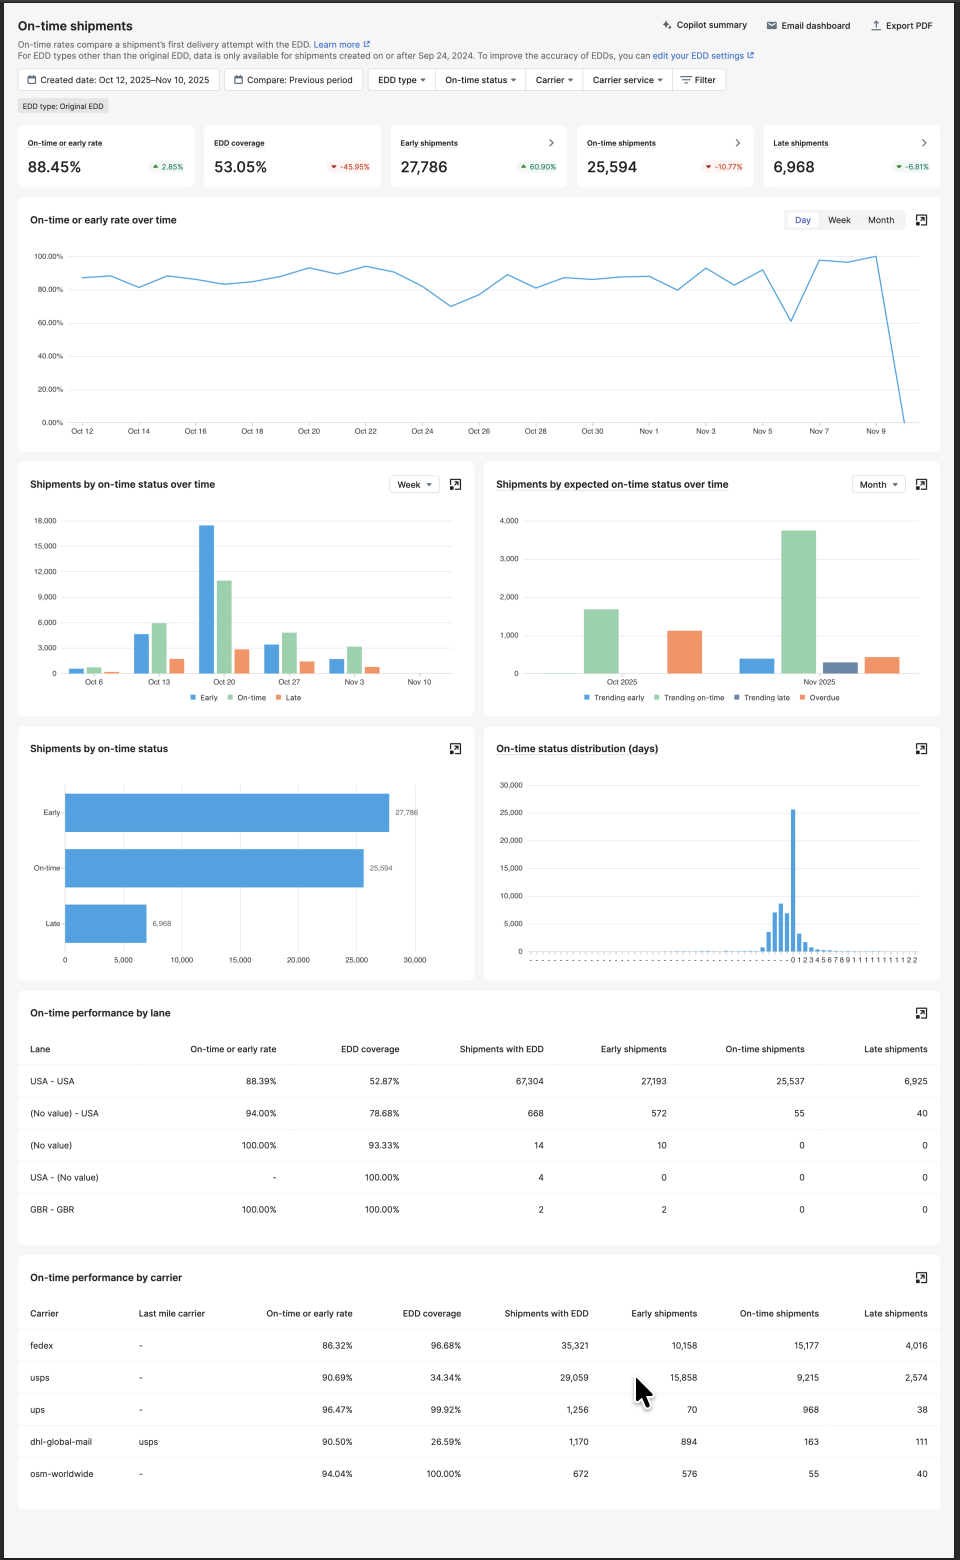
This is the depth that matters for a DTC business case. One shipment record feeds the notification your customer receives, the tracking page they open, the delivery promise at checkout and the analytics your operations team reviews. When a lane underperforms, you see it in the same system that sets the promise and warns the customer, so the fix and the measurement live in one place. An agent answering a customer sees the same status that the analytics report counts.
For your model, that means each lever has an owner and a live data source. Rerun the analysis monthly, compare it with the baseline in your business case, and your CFO sees the return as it accrues rather than as a forecast.
Building Your Business Case: A Template for Your CFO
Build business case supply chain visibility teams can defend. A finance team reviewing an investment request looks for five answers, in a predictable order. Copy this structure into your deck and fill every figure from your own data.
- Executive summary. One slide, written last. State the problem in operating terms, the platform you recommend, total cost of ownership across the contract term, the expected return as a low to high range, and the payback period.
- Current state. Four baselines, each with its source system and extract date: monthly order-status contact volume and fully loaded cost per contact; on-time delivery rate by carrier and service level on your top lanes; exception volume and cost per exception, covering reshipments, refunds and the contacts they generate; and repeat purchase rate for customers whose orders arrived on time against those whose orders arrived late. If a baseline is missing, say so and give the date it will be measured.
- Proposed solution. What changes on day one and who uses it. Name the capabilities going live, the teams that own them, and the systems they connect to, including your OMS, WMS, storefront and helpdesk. List the vendor's published cost components beside each capability so finance can trace every line. Note what stays unchanged, so the scope is clear.
- Financial analysis. Two tables. The first is TCO by year across the five components, modeled per product. The second is ROI per lever, each row showing baseline, assumption, and low, base and high outcomes. Keep the levers on separate rows so each assumption can be challenged on its own, then show the payback period for the base case.
- Implementation plan and risk mitigation. A timeline with milestones, owners and a parallel run before cutover. Then the risks and how the plan contains each one: data quality on your lanes, adoption by the support team, and integration dependencies. Close with the contractual protections you will hold the vendor to, including the uptime commitment, the support tier and the exit terms. Name a decision date and the metric you will report at 90 days.
The Verdict: Why AfterShip Delivers a Faster, Clearer ROI for Retail and DTC
The right platform depends on which job dominates your order volume. Freight-visibility platforms are powerful for inbound and multimodal B2B freight, but they are freight-first and, for DTC post-purchase, tend to be over-engineered and cost-opaque. AfterShip is the specialist choice when DTC post-purchase performance, unified analytics and transparent economics start to matter.
AfterShip Tracking is not built for inbound container or multimodal freight visibility, and a business case centered on those movements is the wrong fit for it. That boundary is deliberate: every part of the product serves the journey from checkout to a delivered or returned parcel, which is where the costs in your model sit.
A freight-first visibility platform fits when:
- Inbound, multimodal and B2B freight movements are the main visibility problem you are solving.
- Your transportation team is the primary buyer and daily user of the platform.
- Your procurement process is built around a custom enterprise contract negotiated from the first call.
- Coverage across freight modes and international lanes carries more weight in your evaluation than the post-purchase experience.
AfterShip Tracking fits when:
- You need a TCO model built from published, shipment-based pricing, including overage, seats and support, before the first sales conversation.
- Carrier and service decisions on your lanes need on-time analytics by origin-destination pair, so volume moves to the services that keep your promises.
- DTC order volume is climbing and delivery promises have to hold through peak season.
- One shipment record should drive customer notifications, the tracking page, the checkout promise and operations reporting.
- Your support team measures success in fewer order-status contacts, and your CFO wants that tracked against the baseline in the business case.
For a DTC brand or retailer presenting to a CFO in 2026, AfterShip Tracking gives you the numbers to model the cost today and the analytics to prove the return once it goes live, in one system your finance, operations and customer service teams all read from.
Proactive shipment tracking that delights your customers, reduces WISMO tickets, and improves your delivery performance.
Book a demoFrequently Asked Questions
What is included in the total cost of ownership of supply chain visibility software?
Total cost of ownership covers five components: license or subscription, implementation and integration, training and change management, ongoing maintenance and support, and hidden costs such as data-quality work, seat growth and usage charges for SMS messages and API calls. Model each one per product and per year across the full contract term.
How do you calculate ROI for supply chain visibility software?
Measure four levers separately against your own baseline: order-status contact volume, customer lifetime value by delivery outcome, carrier and service cost per lane, and exception cost. Apply a defensible assumption to each, show low, base and high outcomes, and compare the result with TCO to find the payback month. Keep the levers on separate rows so finance can test each assumption.
What hidden costs should I ask a visibility vendor about?
Ask for overage rates, seat pricing, SMS and API usage charges, support tier fees, integration effort and the internal time needed to clean carrier data. Request each as a written line item before signing, and ask how each one changes as your shipment volume grows, and what a parallel run costs in staff time.
Who should own the business case for a visibility platform?
The Head of Logistics or Supply Chain Director usually owns it, with a finance partner who signs off on the model. Customer service supplies order-status contact volume and cost, operations supplies carrier performance, and ecommerce supplies repeat purchase data by delivery outcome. Agree on the owners before the first vendor call so every baseline has a named source.
How long does it take to get a visibility platform live?
It depends on scope, and you can only model it before signing when the vendor publishes a figure. A vendor that publishes no go-live window leaves that line of your business case as an open assumption until a contract is in front of you. AfterShip publishes its implementation window on its own pages, so the implementation plan in your deck starts from a number you can check.